
Weekly - 10/13/2026
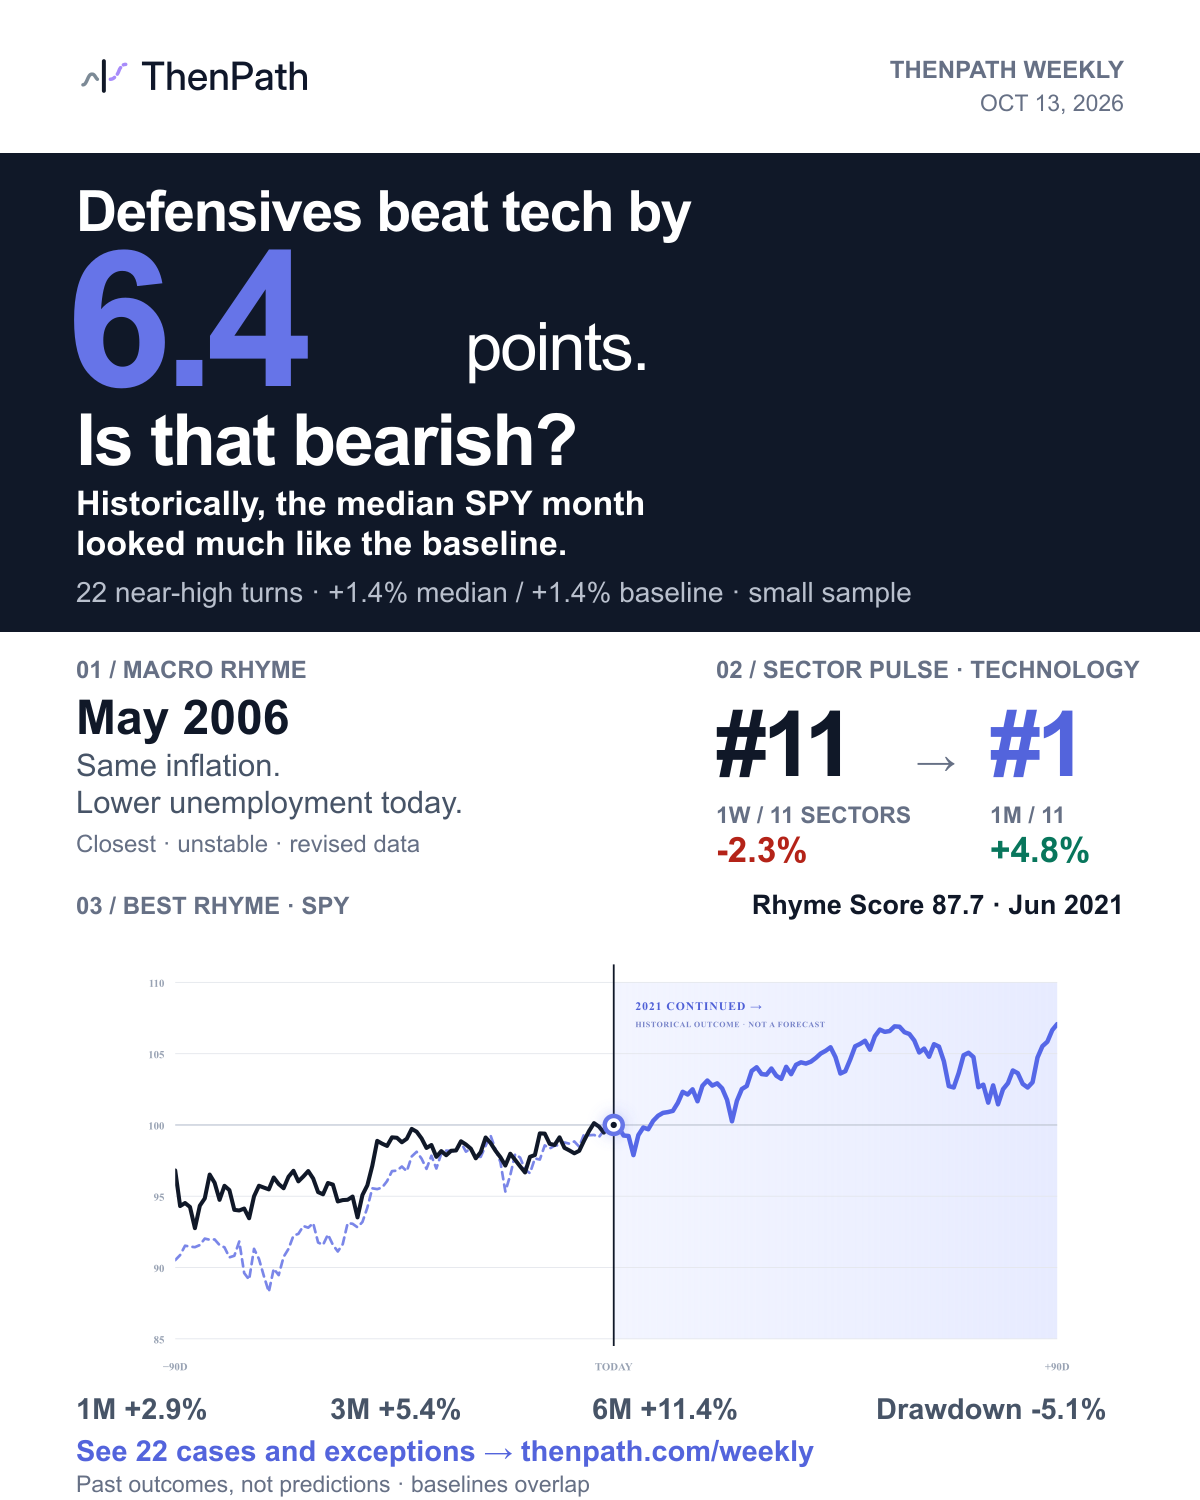
Defensives beat tech by 6.4 points. Is that bearish?
In 22 past near-high defensive turns, SPY’s median next month was +1.4%. The all-day baseline was also +1.4%.
Defensives = equal-weight Utilities and Consumer Staples, versus Technology.
Typical month resembled the baseline. That alone gives little support for a bearish reading.
The losses and alternative definitions
17 positive months, 5 losing months. The worst next month was -5.8%; the worst six-month result was -15.7%. Individual outcomes are observations, not probabilities for today.
| Defensive lead | Events | Median 1M |
|---|---|---|
| 2pp near highs | 34 | +0.5% |
| 4pp near highs | 14 | +1.3% |
| 3pp at any level | 43 | +1.2% |
At the prespecified 2pp near-high threshold, the median next month was +0.5%. The result depends on the definition.
Explore 22 completed cases and 1 pending
| Event | 1M | 3M | 6M |
|---|---|---|---|
| 2000-01-07 | -1.0% | +4.2% | +1.9% |
| 2000-09-06 | -3.4% | -7.7% | -14.5% |
| 2003-07-22 | +1.3% | +6.3% | +17.1% |
| 2004-02-02 | +1.5% | -1.3% | -2.6% |
| 2005-12-14 | +0.9% | +3.1% | -1.1% |
| 2007-01-22 | +2.5% | +4.4% | +9.0% |
| 2011-03-11 | +1.7% | -2.1% | -10.6% |
| 2012-04-19 | -5.8% | +0.5% | +7.3% |
| 2013-04-17 | +6.6% | +8.9% | +10.5% |
| 2014-03-14 | -0.5% | +5.6% | +8.8% |
| 2015-07-07 | +1.0% | -4.1% | -2.1% |
| 2016-04-28 | +1.3% | +5.0% | +4.1% |
| 2017-06-15 | +1.2% | +3.1% | +10.5% |
| 2018-07-30 | +3.6% | -4.8% | -3.4% |
| 2019-09-24 | +1.4% | +9.1% | -15.7% |
| 2020-11-12 | +3.2% | +11.5% | +18.5% |
| 2021-12-06 | +2.4% | -9.0% | -8.8% |
| 2023-07-24 | -3.5% | -6.9% | +7.6% |
| 2024-01-31 | +6.2% | +3.9% | +13.2% |
| 2024-08-26 | +2.0% | +6.5% | +5.0% |
| 2025-05-20 | +0.5% | +8.0% | +12.0% |
| 2025-12-15 | +2.0% | -2.5% | +9.5% |
| 2026-06-29 | -1.6% | +3.6% | Pending |
01 / MACRO RHYME
Closest Macro Rhyme:
May 2006
Similar inflation, lower unemployment today.
Closest does not mean reliable. Removing one indicator changes the historical period.
What matches, and what differs
Inflation is 3.35% versus 3.42%. Unemployment is 4.1% versus 4.7%; the policy rate is 3.63% versus 4.59%; the 10Y–2Y curve is 0.44 versus 0.20 percentage points.
Without the policy rate the closest period becomes Feb 2001; without inflation it becomes Jul 1999. The match is unstable. Monthly observations are from August, deliberately lagged; the curve is from October 9. Revised data do not recreate what investors knew at the time.
02 / SECTOR PULSE
Technology
Last this week.
First this month.
Technology, among 11 sectors. Its weak week has not erased its monthly lead.
Sector returns and historical context
The closest rotation is 2025-11-05, but week-only matching picks 2024-09-09. The resemblance is unstable. Shared history starts 2018-06-19.
- Consumer staples+4.2% / +1.9%
- Utilities+4.2% / -1.1%
- Energy+4.0% / +1.9%
- Real estate+3.1% / -2.6%
- Health care+2.8% / +4.4%
- Financials+2.2% / -3.5%
- Consumer discretionary+1.7% / -0.4%
- Materials-0.1% / -2.5%
- Communication services-0.1% / -0.7%
- Industrials-0.6% / -1.6%
- Technology-2.3% / +4.8%
Returns shown as one week / one month.
03 / BEST RHYME
SPY is rhyming with June 2021
Paths are indexed to TODAY = 100 · The chart shows the next 90 trading days; outcomes below extend to 6 months.
Historical outcomes
What followed the matched period.
- 1M
- +2.9%
- 3M
- +5.4%
- 6M
- +11.4%
- MAX DRAWDOWN
- -5.1%
Historical outcome — not a forecast.
Data through: 2026-10-12