
LEARN · MARKET ANALOGS
What is a stock market analog?
A stock market analog is a historical price period that moved like a market's recent path. It is a comparison tool—not a forecast—and its value depends on how the match is measured and interpreted.
By ThenPath · Updated October 4, 2026
What “analog” means in markets
In market research, an analog is an earlier stretch of price history used as a comparison for the present. The two periods do not need to have the same price level. Instead, the analysis compares the shape and sequence of their moves after putting them on a common scale.
For example, a stock trading at $180 today can be compared with the same stock when it traded at $25. If both 90-day paths rose, paused, fell, and recovered in a similar sequence, they may form a strong price analog even though the dollar prices are very different.
An analog can make an abstract chart easier to investigate. It supplies a concrete historical episode, a known outcome, and a list of differences to examine. It does not establish that the earlier outcome will repeat.
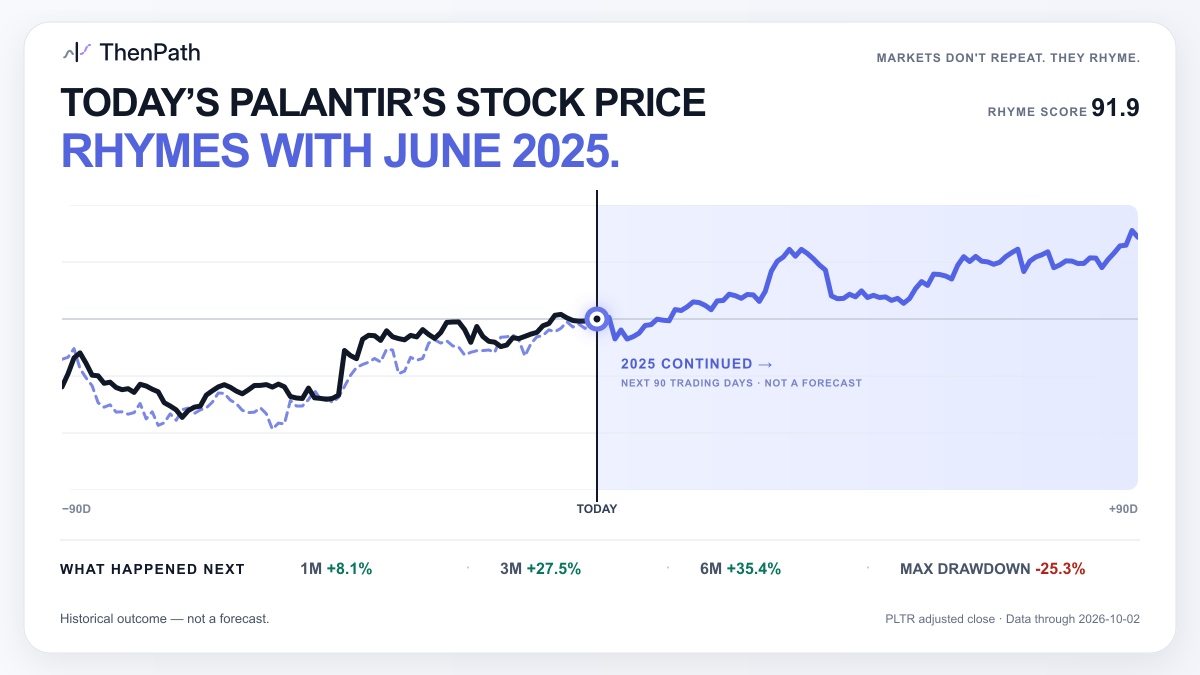
How historical price pattern matching works
- Choose a comparison window. Define how much recent history represents the current setup. ThenPath uses 90 observations: trading sessions for exchange-traded assets and calendar days for crypto.
- Put paths on a common scale. Normalize each path so the comparison focuses on relative movement rather than the absolute price.
- Compare the current path with history. Slide the same-size window through eligible historical data and calculate a similarity score for every candidate.
- Keep the future out of the ranking. Rank candidates using only data inside the two comparison windows. Later returns must not influence which period wins.
- Reveal the recorded outcome. After the match is frozen, examine what actually happened after the historical endpoint, including returns and drawdown.
This separation between matching and outcome is essential. Choosing an analog because its later return looks attractive would be hindsight bias, not a clean historical comparison.
What does a similarity score measure?
ThenPath measures path similarity with the Pearson correlation coefficient and multiplies it by 100 to create a Rhyme Score. The NIST definition of correlation describes Pearson correlation as a measure of the strength of a linear relationship, ranging from −1 to +1.
- A score near 100 means the two normalized paths moved very similarly.
- A score near 0 means there was little linear similarity.
- A negative score means the paths tended to move in opposite directions.
A high score describes the observed path match. It is not a probability, confidence level, or expected return.
Market analogs versus related tools
| Method | Main question | What gets compared |
|---|---|---|
| Historical price analog | When did this path look similar before? | The sequence and shape of price moves |
| Seasonality | How has this asset behaved at this time of year? | Recurring calendar periods |
| Chart pattern | Does the chart resemble a named formation? | Visual features such as breakouts or double tops |
| Backtest | How would a fixed rule have performed historically? | Repeated strategy signals and simulated trades |
These approaches can overlap, but they answer different questions. A single price analog is an historical case study; it is not a strategy backtest or a recurring seasonal sample.
How to read an analog responsibly
Start with the match, then look for reasons it may fail. A useful reading process asks:
- Is the similarity broad, or driven by only a few large moves?
- Did volatility, liquidity, interest rates, or the market regime differ?
- Did the company's business, capital structure, or index membership change?
- How severe was the historical drawdown, not just the ending return?
- Would another reasonable window length produce a different winner?
The U.S. Securities and Exchange Commission's Investor Bulletin on performance claims warns that past performance does not necessarily predict future results and that market conditions and methodology matter when interpreting historical performance.
Common mistakes
- Treating one analog as a forecast. Similar inputs can lead to different outcomes.
- Cherry-picking a famous episode. The comparison rule should select the period before its outcome is viewed.
- Leaking future data. Later prices must not affect the similarity score or ranking.
- Ignoring the downside path. An attractive six-month return can hide a drawdown that would have changed the practical experience.
- Confusing correlation with causation. Similar price movement does not mean the same economic forces were at work.
How ThenPath uses market analogs
ThenPath compares an asset's latest 90-observation path with every eligible historical window in that asset's available history. It publishes the top-ranked eligible match, freezes the result, and shows the historical 1-month, 3-month, and 6-month returns plus maximum drawdown.
Every Weekly Rhyme also includes a “Where the Rhyme Breaks” section because context is part of responsible interpretation. Learn how to compare stock charts across time, read the complete ThenPath methodology, or browse the published Weekly Rhyme archive to see the process applied to stocks and crypto.