
LEARN · RESEARCH EXPLAINED
Do stock chart patterns repeat?
Sometimes a later price path resembles an earlier one. Sometimes an excellent-looking match immediately breaks. Historical analogs document both possibilities; one selected success cannot establish that a pattern predicts the future.
By ThenPath · Published October 4, 2026
A strong example: Micron in 1995 and 2025
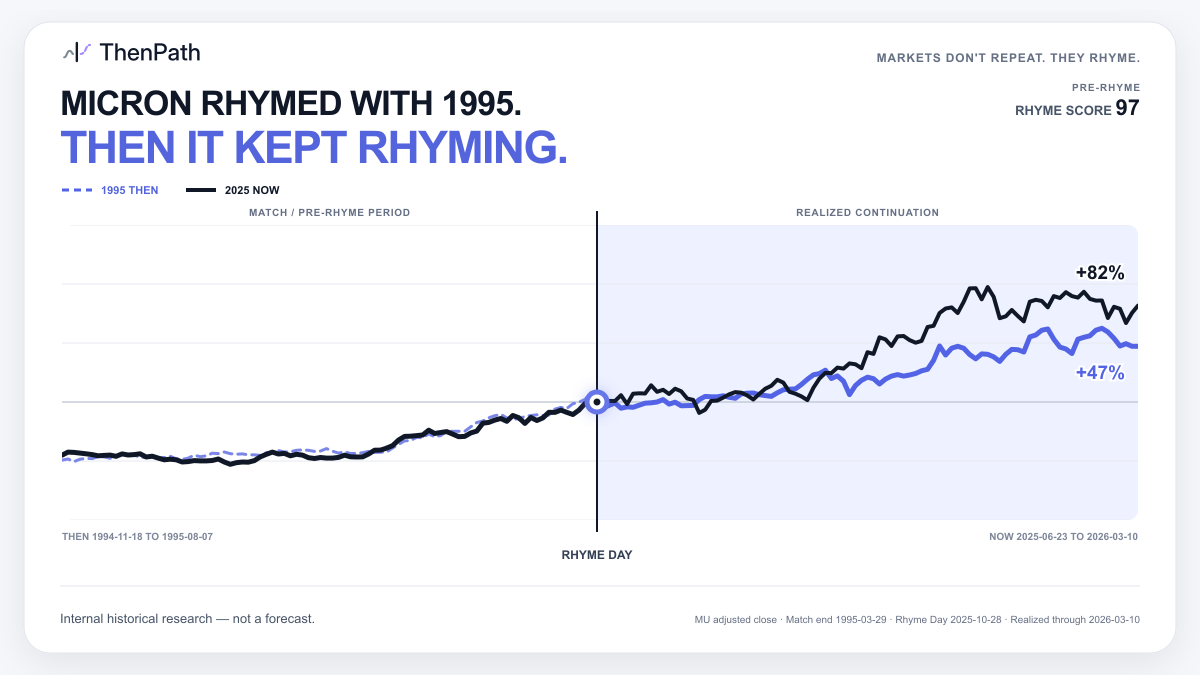
In a retrospective ThenPath research screen, Micron Technology's 90-session path ending October 28, 2025 matched a 90-session Micron path ending March 29, 1995. The two pre-Rhyme paths produced a Rhyme Score of 97 on a 0–100 scale.
After the two endpoints were frozen, the next 90 trading observations also moved in a similar sequence. Their continuation correlation was approximately 0.93. The 1995 continuation finished 47% above its Rhyme Day level; the 2025 continuation finished 82% above its Rhyme Day level.
What the Micron example shows
It shows that a highly similar lead-in and a similarly shaped continuation can occur in real market history, even across a 30-year gap. The result is useful because the match was based on the two 90-observation lead-in windows, while the continuation was measured separately.
It does not show that a 97 Rhyme Score implies a particular probability of success. Nor does it show that Micron's business, valuation, memory cycle, interest-rate environment, or investor base were the same in 1995 and 2025. Path similarity measures movement; it does not establish a shared cause.
A strong match can also fail
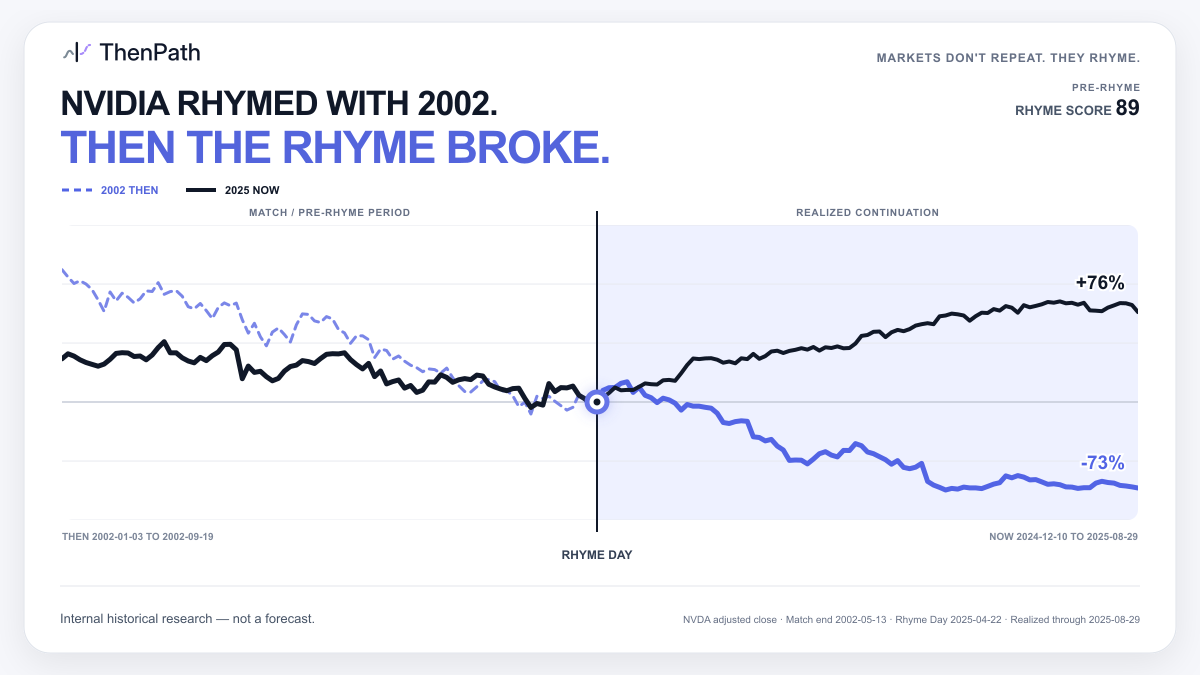
A separate frozen research example matched Nvidia's 90-session path ending April 22, 2025 with a path ending May 13, 2002. Its pre-Rhyme Score was 89—still a strong visual and statistical match.
The continuations then moved in opposite directions. The historical 2002 path fell 73%, while the 2025 path rose 76%; their 90-observation continuation correlation was approximately −0.95. The lead-in rhyme was real, and so was the break.
How these examples were selected
The exploratory screen evaluated 2,829 query endpoints across 41 stocks, ETFs, and crypto instruments. Each query used a 90-observation lead-in. A candidate counted as a successful continuation when its pre-Rhyme Score was at least 80, its next-90-observation correlation was at least 0.70, and both continuations ended in the same direction.
The screen found 203 successful candidate rows, then ranked successful examples by continuation correlation and pre-score, with one displayed case per ticker. The observations overlap, and the displayed successes were deliberately selected after their outcomes were known.
Why similar patterns may appear
Recurring paths can have several possible explanations: repeated investor behavior, similar positioning, common liquidity shocks, business cycles, or simple coincidence in a large search space. A price-only match cannot distinguish among them.
That is why the next research question is not merely “Does this chart look similar?” It is “Was the rule specified before the outcome, how often did it work across all eligible observations, and did it survive new data?”
What would stronger evidence require?
- Pre-registration: fix the universe, window, score, threshold, and outcome before testing.
- Walk-forward evaluation: select each match using only information available at that date.
- All outcomes: retain successes, failures, and ambiguous cases rather than publishing only winners.
- Non-overlapping checks: reduce dependence created by heavily overlapping windows.
- Economic realism: include transaction costs, liquidity, and an explicit decision rule if testing a strategy.
- Regime analysis: examine whether results change across volatility, rates, and market conditions.
The CFA Institute's backtesting overview highlights look-ahead bias, survivorship bias, structural breaks, and the limits of treating historical distributions as a complete description of future uncertainty.
So, do patterns repeat?
Patterns repeat as historical shapes. Their outcomes do not repeat reliably just because the shapes match. The disciplined use of an analog is therefore investigative: find the closest precedent, reveal what happened, study where the contexts differ, and preserve the possibility that the rhyme breaks.
Learn how this differs from traditional technical analysis, or review how stock market analogs are constructed.