
LEARN · METHODS COMPARED
Historical pattern matching vs. technical analysis
Both approaches use price history, but they are not interchangeable. Historical pattern matching searches for the closest earlier path under a fixed rule; technical analysis is a broader family of chart, trend, volume, and indicator methods.
By ThenPath · Published October 4, 2026
What is technical analysis?
Technical analysis studies market-generated data—especially price and volume—to describe trends, momentum, support and resistance, relative strength, and chart formations. Some implementations are discretionary; others translate those ideas into explicit algorithms.
FINRA's overview of market timing distinguishes technical analysis based on price or volume patterns from quantitative analysis based on mathematical or statistical methods. The categories can overlap when a traditional chart idea is formalized as code.
What is historical pattern matching?
Historical price pattern matching defines a fixed recent window, puts it on a common scale, and compares it with equally sized windows from eligible history. A similarity measure ranks every candidate, producing a specific earlier episode rather than a generic label such as “double bottom” or “uptrend.”
ThenPath uses 90-observation paths and Pearson correlation. The NIST definition of correlation explains that the Pearson coefficient measures the strength of a linear relationship from −1 to +1. ThenPath multiplies that coefficient by 100 for the Rhyme Score.
| Question | Historical pattern matching | Technical analysis |
|---|---|---|
| Primary object | An entire fixed-length price path | Trends, formations, levels, indicators, and volume |
| Typical output | A ranked earlier episode and similarity score | A pattern label, signal, level, or market-state interpretation |
| Selection | Systematic scan of eligible history | May be visual, rule-based, or algorithmic |
| Scale | Usually normalized to compare shape across price levels | May use price, percentage, logarithmic, or indicator scales |
| Main risk | Data mining and over-interpreting the nearest neighbor | Subjective labeling, parameter choice, and false signals |
A concrete pattern-matching example
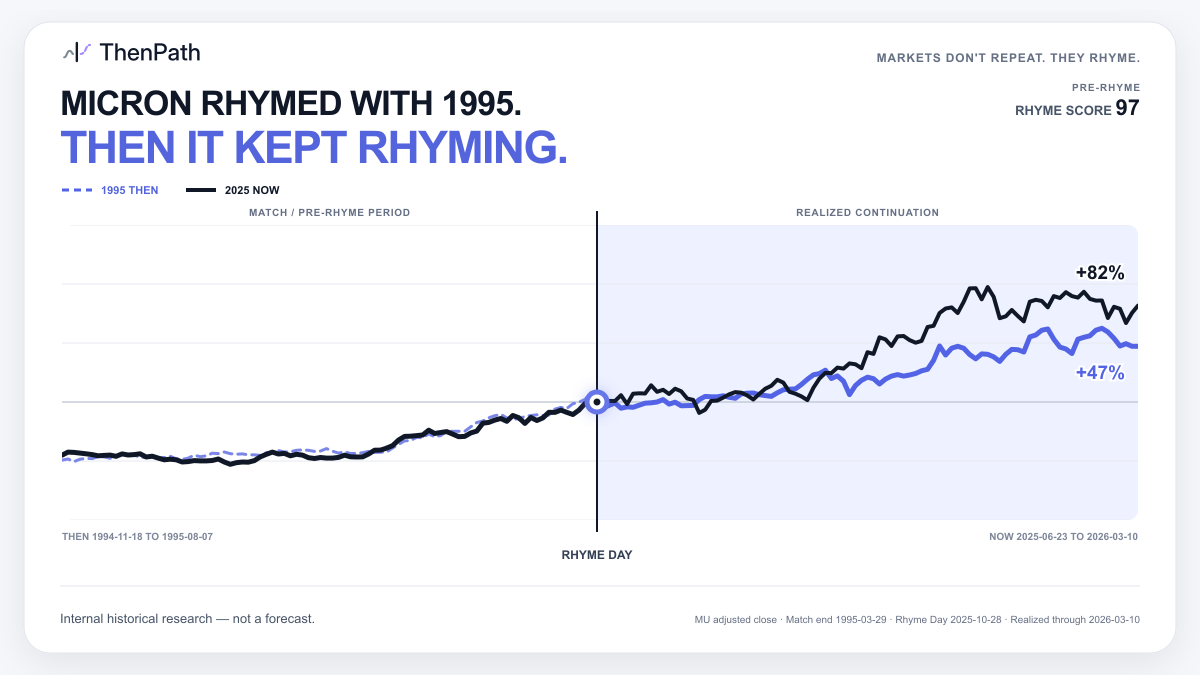
Micron's 90-session path ending October 28, 2025 was compared with every eligible 90-session window in its earlier history. The top match ended March 29, 1995 and scored 97. The comparison did not begin with a named chart formation; it began with a numerical nearest-neighbor search.
Where the methods overlap
Both methods assume that price history contains structure worth examining. Both may use normalized charts, returns, volatility, and statistical filters. And both become more reproducible when the analyst defines the rule before viewing the outcome.
Research summarized by the CFA Institute on algorithmic technical analysis illustrates this overlap: named formations can be converted into geometric definitions and detected systematically. At that point, the difference is less “human versus computer” and more “what exactly is being searched and how is it scored?”
Historical matching is not automatically a backtest
A single analog is a historical case study. A backtest requires a complete decision rule applied repeatedly through time, with all eligible observations and outcomes retained. It should specify when a signal occurs, what position follows, how long it is held, and how costs and risk are measured.
Showing what happened after the closest match is informative, but it is not the same as testing a trading strategy. If the outcome helps determine which match gets displayed, the result is retrospective selection rather than clean out-of-sample evidence.
Which method should you use?
- Use a historical analog when you want a concrete precedent, a known later path, and a structured list of contextual differences.
- Use technical analysis when your question concerns trend, momentum, support, resistance, volume, or a defined formation.
- Use a backtest when you want to evaluate a repeatable decision rule across many observations.
- Use fundamental analysis when your question concerns cash flows, competitive position, valuation, or business quality.
These methods can complement one another. None should turn a visually persuasive chart into certainty about the next move.
How to evaluate either approach
- Write down the rule before looking at the continuation.
- Keep future data out of pattern selection and parameter tuning.
- Show failures alongside successes.
- Separate path similarity from probability and expected return.
- Test whether the result survives different reasonable windows and regimes.
- Compare market and company context before acting on an analogy.
For an example of both outcomes, read Do stock chart patterns repeat? For the complete implementation used on ThenPath, see the methodology.